The 3 pillars of observability in Quarkus
Quarkus
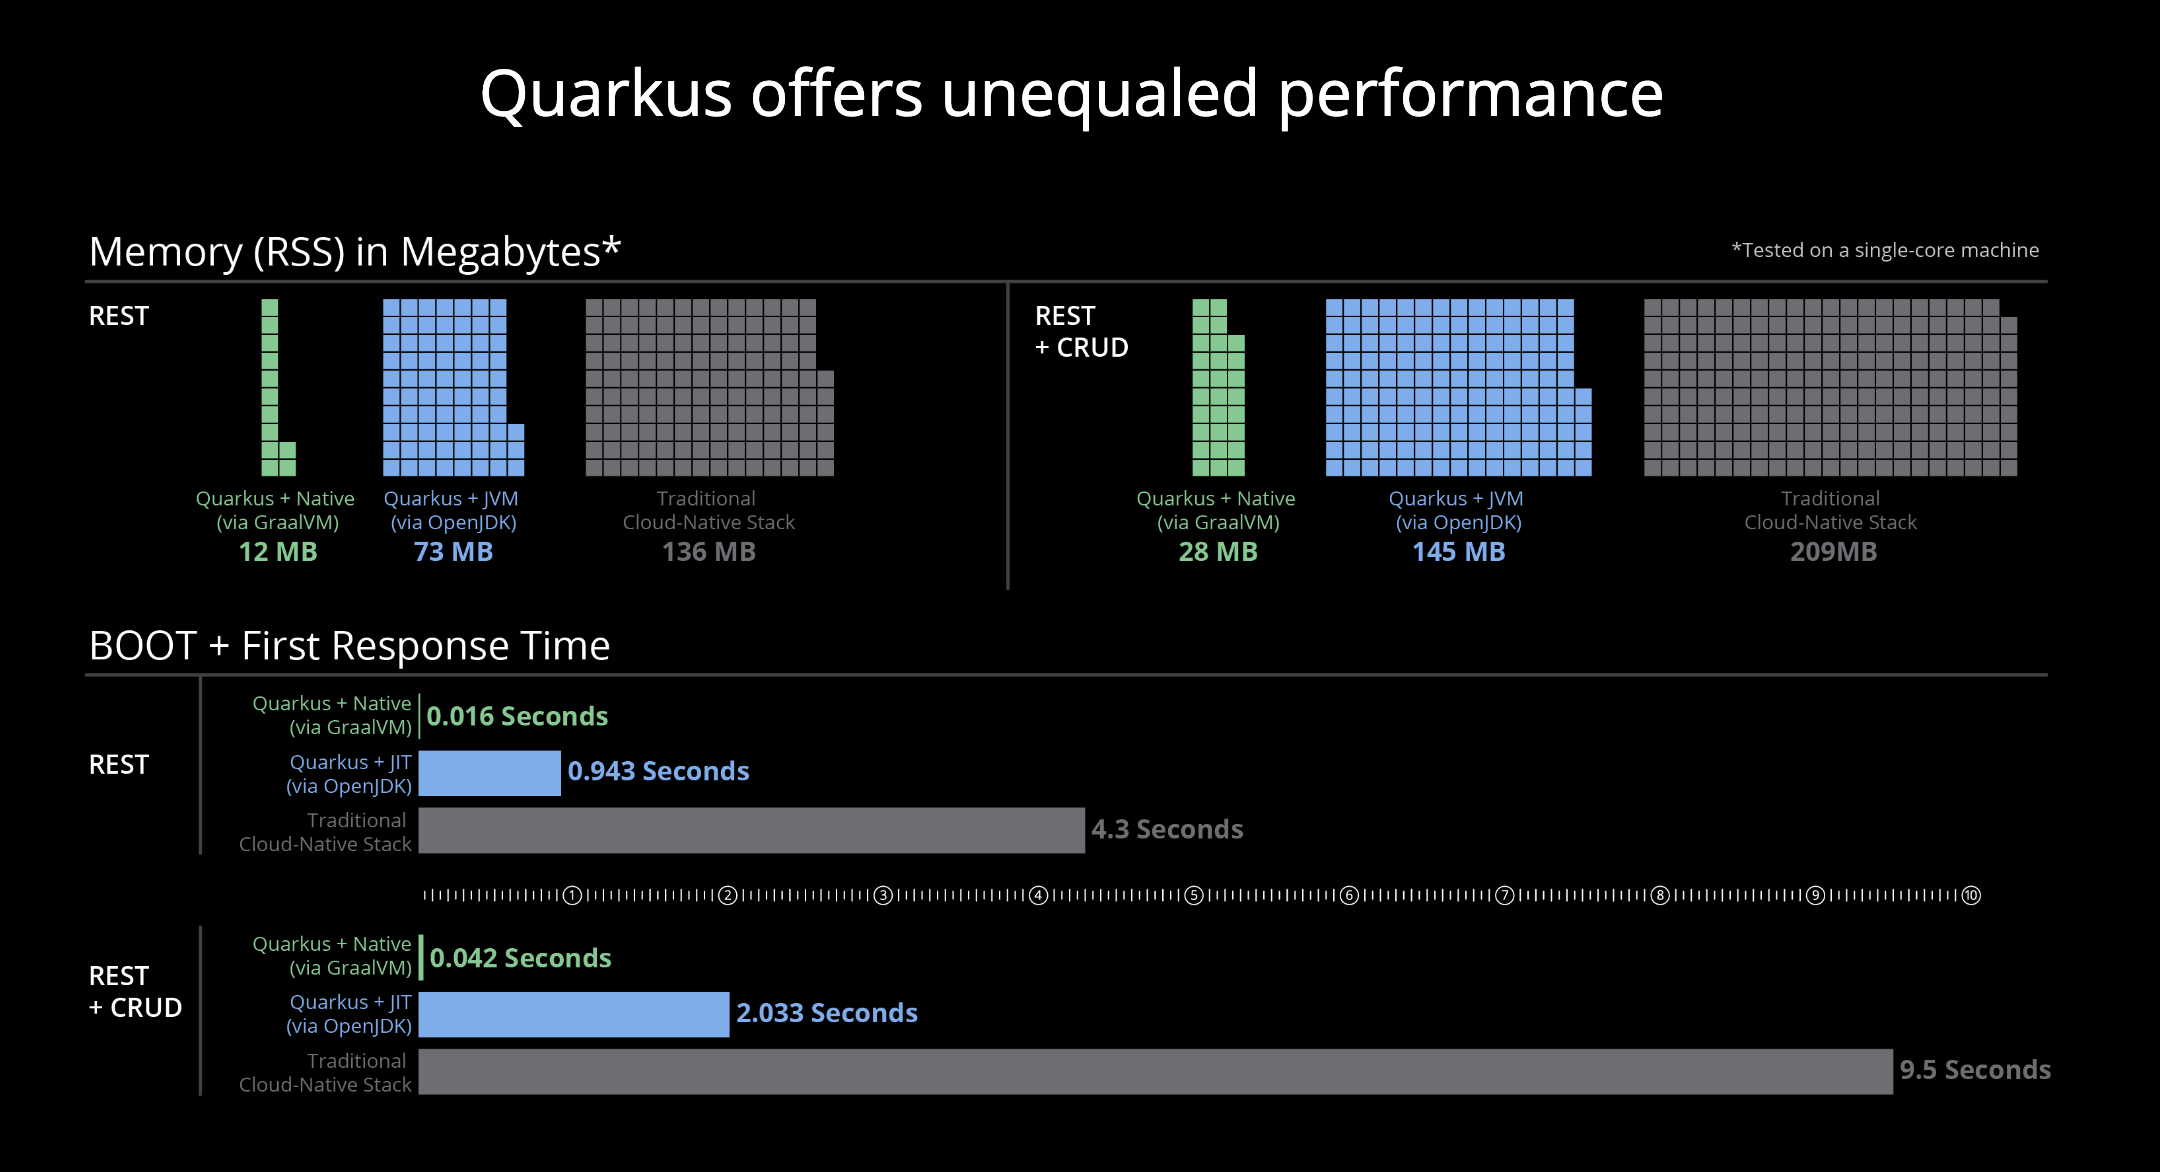
Quarkus is part of a new crop of lightweight, fast, container first Java frameworks. Designed to cut out the cruft of legacy frameworks like Spring Boot and built from the ground up on battle tested libraries from Vert.x and Microprofile.
I could wax poetic for days about Quarkus but the killer features for me are:
- Developer Joy - live reloading, nothing beats saving your file and immediately reloading your page with the changes
- Speed - None of that would be possible if it wasn’t fast, see image above. It is a true breath of fresh air coming from most other JVM projects
- Built on battle-tested libraries - very little is built specifically for Quarkus, instead they’ve leveraged the JVM’s vast ecosystem of incredible libraries to put together something quite special.
- Mixing imperitive and reactive code - No need to choose between going full reactive or staying old school, you can mix blocking code in the same file as reactive.
Back to Observability…
The 3 Pillars of Observability
Logs, metrics, and traces are often known as the three pillars of observability.
While Quarkus does provide good options for all of the pillars, viewing them as a holistic observability stack is relatively new and not all tools support all providers. It’s common to use ELK for log aggregation, Grafana and Prometheus for Metrics and OpenZipkin or Jaeger for Tracing. Who all have there own way of instrumenting your code and exporting that data for the provider to aggregate.
Fortunately the industry has coalesced around opentelemetry as platform agnostic protocol to collect and ship observability data to various providers. Unfortunately at the time of writing only Tracing is considered Stable, Metrics considered Mixed and Logging still Experimental.
Quarkus uses JBoss Logging for logging, Micrometer for metrics and OpenTelemetry, now you need to get all that data from your application to whatever you are using to aggregate and view this data. In my case I’m using an ELK stack hosted by Logz.io for log aggregation and monitoring and New Relic to store metrics and traces. My goal is stick as close as possible to the frameworks default or recomended tools, while remaining as vendor neutral as possible. Making the inevitable migration to the next hot observability stack as seemless as possible.
Logs
An event log is an immutable, timestamped record of discrete events that happened over time.
Logging is definetly the original form of observability, being as simple as println to STDOUT. Un/Fortunately modern logging libraries provide many more bells and wistles, allowing deeper insight into what has happened during your programs execution.
A common pattern for modern logging is to output structual logs to a file as JSON, to be picked up by a log shipper running on the host (like filebeat) and shipped and aggregated on the server.
Unfortunately Quarkus’ choice of JBoss Logging leaves much to be desired when supporting this use case, while you can output structual logs as JSON - it does not output that JSON to the logfile. Instead outputing only to STDOUT, the prefered way for log aggregation is GELF but that requires a custom Logstash server not supported in the current stack.
Luckily there is a logback extension, redirecting all the logs from JBoss Logging to Logback. Logback has excellent support for this logging workflow, being my go to logging library on the JVM.
To add support we just need to add some dependencies:
dependencies {
    ...
    implementation 'io.quarkiverse.logging.logback:quarkus-logging-logback:0.11.0'
    implementation 'net.logstash.logback:logstash-logback-encoder:7.0.1'
    implementation 'org.codehaus.janino:janino:3.1.6'
    ...
}
And a logback.xml in the resources folder:
<?xml version="1.0" encoding="utf-8"?>
<configuration packagingData="true">
  <variable name="APP_NAME" value="${APP_NAME:-quarkus}" />
  <variable name="APP_VERSION" value="${APP_VERSION:-DEVELOPMENT}" />
  <variable name="ENVIRONMENT" value="${ENVIRONMENT:-DEVELOPMENT}" />

  <if condition='isDefined("LOG_FILE_PATH")'>
    <then>
      <appender name="FILE" class="ch.qos.logback.core.rolling.RollingFileAppender">
        <file>${LOG_FILE_PATH}/ono-bankserv.log</file>
        <rollingPolicy class="ch.qos.logback.core.rolling.TimeBasedRollingPolicy">

          <!-- daily rollover -->
          <fileNamePattern>${LOG_FILE_PATH}/ono-bankserv-%d{yyyyMMdd}.log</fileNamePattern>
          <!-- keep 3 days' worth of history capped at 1GB total size -->
          <maxHistory>3</maxHistory>
          <totalSizeCap>1GB</totalSizeCap>
        </rollingPolicy>
        <encoder class="net.logstash.logback.encoder.LogstashEncoder">
          <customFields>
            {"app_name":"${APP_NAME}","app_version": "${APP_VERSION}", "environment": "${ENVIRONMENT}"}
          </customFields>
          <shortenedLoggerNameLength>5</shortenedLoggerNameLength>
          <throwableConverter class="net.logstash.logback.stacktrace.ShortenedThrowableConverter">
            <maxDepthPerThrowable>30</maxDepthPerThrowable>
            <shortenedClassNameLength>20</shortenedClassNameLength>
            <rootCauseFirst>false</rootCauseFirst>
          </throwableConverter>
        </encoder>
      </appender>

      <root level="${QUARKUS_LOG_LEVEL}">
        <appender-ref ref="FILE" />
      </root>
    </then>
  </if>
</configuration>
Just make sure LOG_FILE_PATH is somewhere Filebeat is configured to read and we are off to the races.
Metrics
Metrics are a numeric representation of data measured over intervals of time
The recommended way to collect metrics in Quarkus is with Micrometer, Micrometer is a vendor neutral applications metric facade. The Quarkus extension includes a good baseline of metrics to collect about your aplication and the JVM it runs on.
To export the data Micrometer works with the concept of Registriess, quarkiverse inculdes extensions for most metric registries supported by Micrometer. For New Relic the default registry implemented by the extension at the time was using the old New Relic SDK, which did not play nicely with there OpenTelemetry support (which we used to ship our traces). This has since been rectified and they’ve provided a new registry that uses New Relics own Micrometer registry but for the purposes of this blog I’ll be showing how simple it is to integrate it yourself.
First let us add the dependencies:
dependencies {
    ...
    implementation 'io.quarkus:quarkus-micrometer'
    implementation 'com.newrelic.telemetry:micrometer-registry-new-relic:0.10.0'
    ...
}
Then it is as simple as providing a custom Metrics registry:
...
import com.newrelic.telemetry.micrometer.NewRelicRegistry;
import com.newrelic.telemetry.micrometer.NewRelicRegistryConfig;
import io.micrometer.core.instrument.util.NamedThreadFactory;

@Slf4j
@Singleton
public class Config {

  @Produces
  @Singleton
  public NewRelicRegistryConfig newRelicConfig(
      @ConfigProperty(name = "quarkus.application.name") String serviceName,
      @ConfigProperty(name = "newrelic.uri") String uri,
      @ConfigProperty(name = "newrelic.apiKey") String apiKey,
      @ConfigProperty(name = "newrelic.step") Duration step) {
    log.info("Starting New Relic Service Name: " + serviceName);
    return new NewRelicRegistryConfig() {
      @Override
      public String get(String key) {
        return null;
      }

      @Override
      public String apiKey() {
        return apiKey;
      }

      @Override
      public Duration step() {
        return step;
      }

      @Override
      public String serviceName() {
        return serviceName;
      }

      @Override
      public String uri() {
        return uri;
      }
    };
  }

  @Produces
  @Singleton
  public NewRelicRegistry newRelicMeterRegistry(NewRelicRegistryConfig config)
      throws UnknownHostException {
    NewRelicRegistry newRelicRegistry = NewRelicRegistry.builder(config).build();
    newRelicRegistry.start(new NamedThreadFactory("newrelic.micrometer.registry"));
    return newRelicRegistry;
  }
}
And make sure we provide the required config:
newrelic:
  uri: https://metric-api.eu.newrelic.com/metric/v1
  apiKey: ${NEW_RELIC_LICENSE_KEY}
  step: 10s
Boom and you should see your application in New Relic, now let us add some traces to go with those metrics.
Traces
A trace is a representation of a series of causally related distributed events that encode the end-to-end request flow through a distributed system.
Tracing allows you to see what happened across a microservices, it is a vendor agnostic way to provide visibilty into the request lifecycle across multiple services, similar to what APM tools did for a single service. Various implementations have been released by various big tech companies over the years; Twitter with Zipkin, Google with Dapper and Uber with Jaeger. This has all now become standardised with OpenTelementry.
New Relic provides OpenTelemetry endpoints and Quarkus comes with an OTLP Extension. So it is as simple as installing the dependency and pointing it at the NR endpoints:
dependencies {
  ...
  implementation 'io.quarkus:quarkus-opentelemetry-exporter-otlp'
  ...
}
quarkus:
  opentelemetry:
    enabled: true
    tracer:
      enabled: true
      exporter:
        otlp:
          endpoint: https://otlp.eu01.nr-data.net:443
          headers: api-key=${NEW_RELIC_LICENSE_KEY}
And boom tracing done.
Conclusions
Observability has come a long way from deep vendor locked solutions which New Relic was the king of, to loosely coupled, vendor agnostic instrumentation and protocols. Allowing your app to easily move between vendors and solutions depending on the needs of the organisation. Allowing to focus on correctly instrument your application once and not worry about having to redo everything later.